提出问题
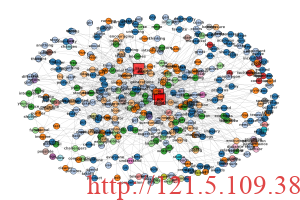
最近有些文档想要可视化展示效果,奈何一些软件需要付费,且展示的效果不尽人意。因此,结合之前做过的一些可视化研究,利用python重写了相关语义网络可视化效果。
解决问题
原理:通过计算共现次数,保留共现次数高的(这里是>=4次)。
import docx
import nltk
from nltk import word_tokenize, FreqDist
from nltk.corpus import stopwords
import networkx as nx
import matplotlib.pyplot as plt

def read_word_file(file_path):
    # Open the Word document
    doc = docx.Document(file_path)
    # Store the text content
    text = ""
    for para in doc.paragraphs:
        text += para.text + " "
    return text

def preprocess_text(text):
    # Tokenize the text
    words = word_tokenize(text.lower())

    # Remove stopwords, punctuation, and non-alphabetic words
    stop_words = set(stopwords.words('english'))
    words = [word for word in words if word.isalpha() and word not in stop_words]

    return words

def calculate_co_occurrence(words):
    # Calculate co-occurrence relationships between words
    co_occurrence = {}
    window_size = 3  # Adjust the window size as needed

    for i, word in enumerate(words):
        for j in range(1, window_size + 1):
            if i + j < len(words):
                next_word = words[i + j]
                if word != next_word:
                    key = (word, next_word)
                    co_occurrence[key] = co_occurrence.get(key, 0) + 1

    return co_occurrence

def create_semantic_network(co_occurrence):
    # Remove co-occurrence relationships with a count of 1
    co_occurrence = {key: value for key, value in co_occurrence.items() if value > 3}

    # Create a weighted graph with co-occurrence counts as edge weights
    graph = nx.DiGraph()

    for (word1, word2), count in co_occurrence.items():
        graph.add_edge(word1, word2, weight=count)

    return graph

def cluster_graph(graph):
    # Perform clustering on the graph using Louvain method
    clustering = nx.algorithms.community.modularity_max.greedy_modularity_communities(graph)
    clusters = {node: cluster_id for cluster_id, cluster in enumerate(clustering) for node in cluster}
    return clusters

def visualize_semantic_network(graph, central_words, clusters):
    # Draw the semantic network graph with clustering information
    plt.figure(figsize=(12, 8))
    pos = nx.spring_layout(graph, k=0.7, seed=42)  # Adjust 'k' for node dispersion

    # Extract edge weights for edge labels
    edge_labels = {(word1, word2): graph[word1][word2]['weight'] for word1, word2 in graph.edges()}

    # Determine node colors based on clusters
    node_colors = [clusters[node] for node in graph.nodes()]
    cmap = plt.get_cmap('tab20', max(node_colors) + 1)
    nx.draw(graph, pos, with_labels=True, node_size=300, node_color=node_colors, cmap=cmap,
            font_size=10, font_weight='bold', width=0.5, edge_color='gray', arrows=True, arrowstyle='->',
            connectionstyle='arc3,rad=0.2', alpha=0.7)

    # Draw the custom nodes (central words) with larger size and red color
    custom_nodes = [node for node in central_words if node in graph.nodes()]
    for node in custom_nodes:
        graph.add_node(node)  # Add central word to the graph if it's not already present
    nx.draw(graph, pos, with_labels=True, node_size=1000, node_color='red', cmap=cmap,
            font_size=10, font_weight='bold', width=0.5, edge_color='gray', arrows=True, arrowstyle='->',
            alpha=0.7, nodelist=custom_nodes, node_shape='s')

    # Draw edge labels (co-occurrence counts)
    nx.draw_networkx_edge_labels(graph, pos, edge_labels=edge_labels, font_size=8)

    # Save the plot
    plt.savefig('semantic_network.png', dpi=300)
    plt.show()

# Rest of the code remains the same

def main():
    file_path = "./data/xxx.docx"  # Replace with the actual path of your Word document

    # Read the Word document
    text = read_word_file(file_path)

    # Preprocess the text
    words = preprocess_text(text)

    # Calculate co-occurrence relationships between words
    co_occurrence = calculate_co_occurrence(words)

    # Find the central words (the top three most frequent words)
    central_words = [word for word, _ in FreqDist(words).most_common(3)]

    # Create a semantic network graph
    graph = create_semantic_network(co_occurrence)

    # Perform clustering on the graph
    clusters = cluster_graph(graph)

    # Visualize the semantic network graph with the top three central words marked in red and clustering information
    visualize_semantic_network(graph, central_words, clusters)

if __name__ == "__main__":
    main()
文章评论