提出问题
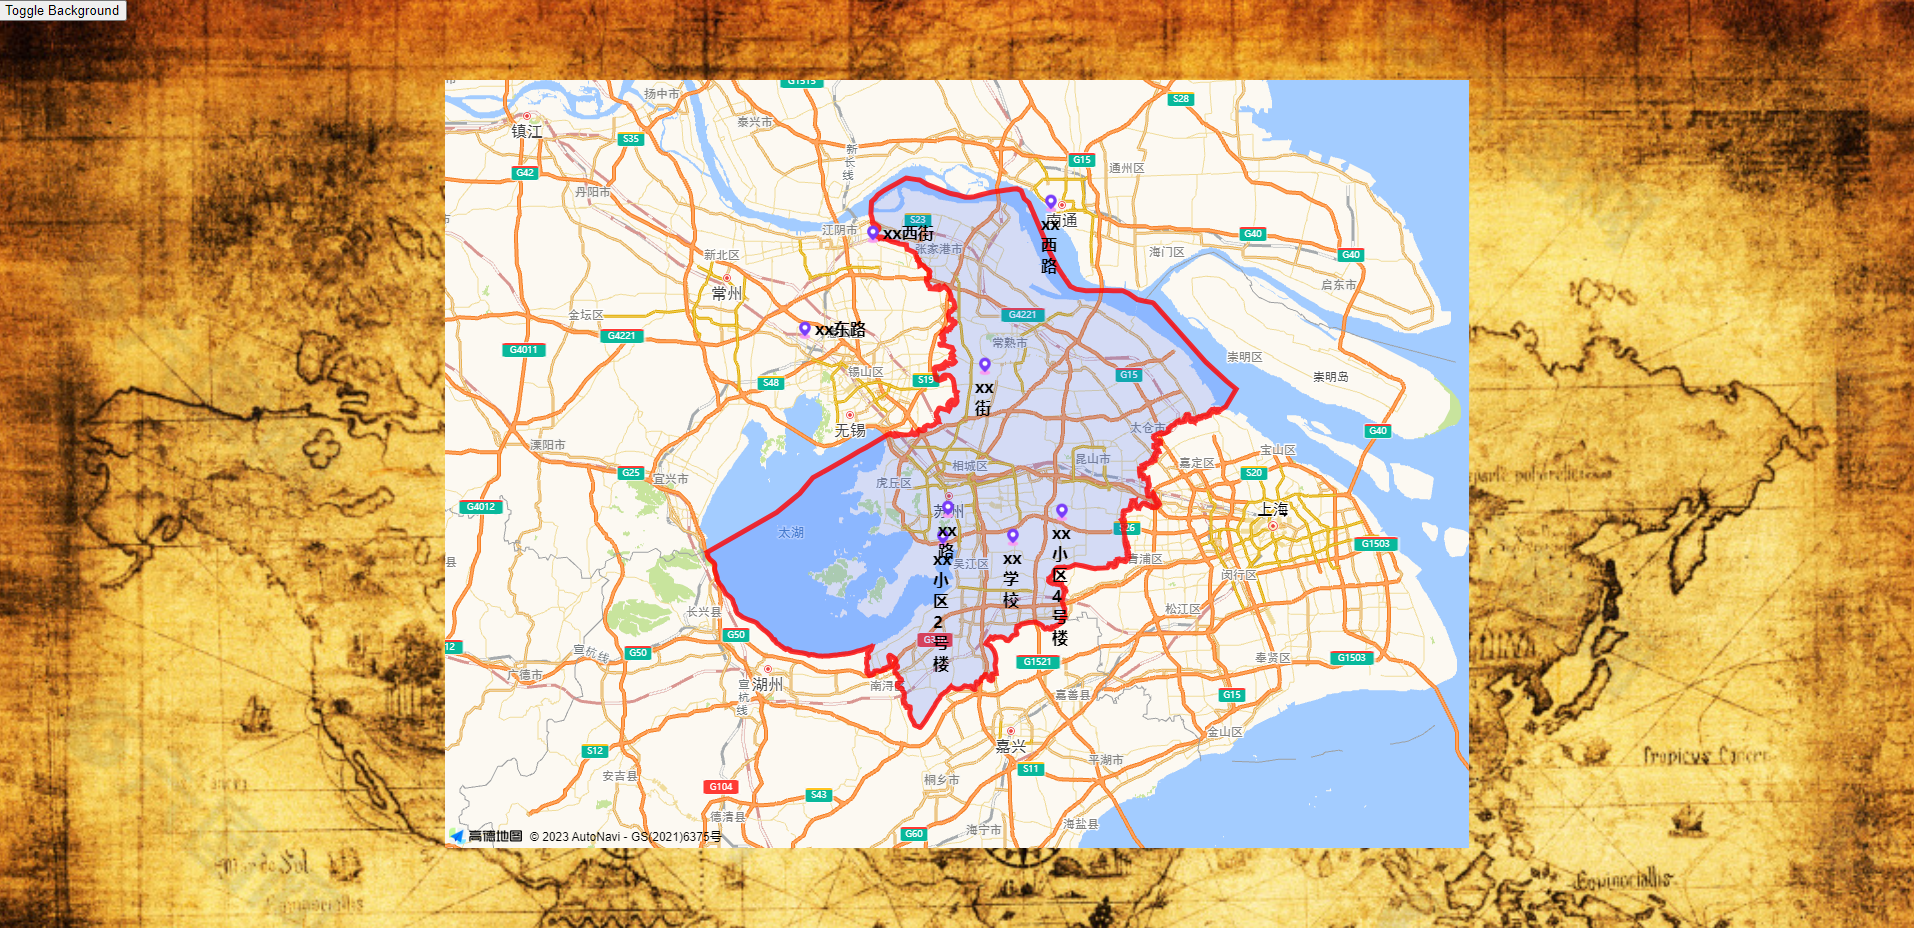
近期因为项目需求,需要在前端出一个地图海报,并要求有指定背景。因此,利用高德web服务api,实现了需求。
高德api介绍
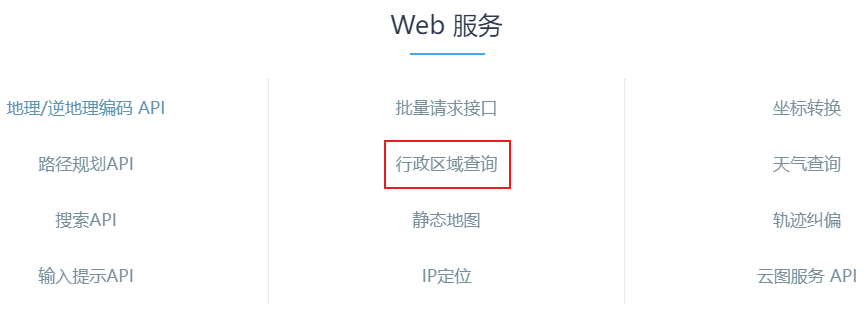
目前高德web服务api可以提供以上几个服务,我们主要利用了其行政区域查询api。更详细的相关api介绍可以查询:web服务API
代码
import webbrowser
import requests
import pandas as pd
import time
from selenium import webdriver

def create_district_map_with_points(location_name, excel_file, background_image_path, amap_api_key):
    # From Excel file
    df = pd.read_excel(excel_file)

    # Get administrative district boundary points for Suzhou
    district_boundary_points = get_district_boundary_points(location_name, amap_api_key)

    if district_boundary_points:
        # Create JavaScript code to display administrative district boundaries as polygons
        boundary_script = create_boundary_polygons(district_boundary_points)

        # Construct HTML
        map_html = f"""
        <!DOCTYPE html>
        <html>
        <head>
            <title>{location_name} District Map with Points</title>
            <script src="https://webapi.amap.com/maps?v=1.4.15&key={amap_api_key}"></script>
            <style>
                body {{
                    margin: 0;
                    padding: 0;
                    overflow: hidden;
                    background-image: url('{background_image_path}');
                    background-size: cover;
                }}
                #map-container {{
                    position: absolute;
                    left: 50%;
                    top: 50%;
                    transform: translate(-50%, -50%);
                    width: 1024px;
                    height: 768px;
                }}
            </style>
        </head>
        <body>
            <div id="map-container"></div>
            <button id="toggle-button">Toggle Background</button>
            <script>
                var mapVisible = true;

                var map = new AMap.Map('map-container', {{
                    zoom: 10,
                    center: [{district_boundary_points[0][0]}, {district_boundary_points[0][1]}],
                }});

                // Create administrative district boundaries as polygons
                {boundary_script}

                // Create markers
                {create_markers(df)}

                // Info window to display attributes
                var infoWindow = new AMap.InfoWindow({{offset: new AMap.Pixel(0, -30)}});

                // Click event listeners for markers
                {add_marker_click_listeners(df)}

                // Toggle background image
                var toggleButton = document.getElementById('toggle-button');
                toggleButton.addEventListener('click', function() {{
                    mapVisible = !mapVisible;
                    if (mapVisible) {{
                        document.body.style.backgroundImage = 'url("{background_image_path}")';
                        map.setMapStyle('normal');
                    }} else {{
                        document.body.style.backgroundImage = 'url("{background_image_path}")';
                        map.setMapStyle('amap://styles/dark');
                    }}
                }});
            </script>
        </body>
        </html>
        """

        with open(f"{location_name}_district_map_with_points.html", "w", encoding="utf-8") as html_file:
            html_file.write(map_html)

        print(f"District map with points for {location_name} saved as {location_name}_district_map_with_points.html")

        # Open the saved HTML file in a web browser
        webbrowser.open(f"{location_name}_district_map_with_points.html")

    else:
        print("Unable to retrieve administrative district boundary data for the specified location.")

# Create JavaScript code to display administrative district boundaries as polygons
def create_boundary_polygons(district_boundary_points):
    boundary_script = """
    var districtPolygon = new AMap.Polygon({
        path: ["""

    for point in district_boundary_points:
        boundary_script += f"[{point[0]}, {point[1]}],"

    boundary_script = boundary_script.rstrip(',')  # Remove the trailing comma
    boundary_script += """
        ],
        strokeColor: "#FF0000",  // Set the stroke color to red (#FF0000)
        strokeWeight: 5,
        strokeOpacity: 0.8,
        fillOpacity: 0.2,
        fillColor: "#3366FF"
    });
    districtPolygon.setMap(map);
    """
    return boundary_script

# 创建JavaScript代码以创建标记点
def create_markers(df):
    marker_script = ""
    for index, row in df.iterrows():
        marker_script += f"""
        var marker{index} = new AMap.Marker({{
            position: [{row['经度']}, {row['纬度']}],
            title: '{row['店铺名称']}',
            content: '<strong><img src="custom_marker.png" style="vertical-align: middle; width: 20px; height: 20px;" />{row['店铺名称']}</strong>',
            map: map
        }});
        """
    return marker_script

# Create JavaScript code to add click event listeners for markers
def add_marker_click_listeners(df):
    listener_script = ""
    for index, row in df.iterrows():
        listener_script += f"""
        marker{index}.on('click', function () {{
            infoWindow.setContent('<strong>{row['店铺名称']}</strong><br>店铺类型: ${row['店铺类型']}');
            infoWindow.open(map, this.getPosition());
        }});
        """
    return listener_script

# Function to get administrative district boundary points
def get_district_boundary_points(district_name, amap_api_key):
    url = f'http://restapi.amap.com/v3/config/district?key={amap_api_key}&keywords={district_name}&subdistrict=1&extensions=all'
    response = requests.get(url)
    data = response.json()
    if data['status'] == '1' and data['info'] == 'OK':
        boundary_points = []
        for point_str in data['districts'][0]['polyline'].split(';'):
            lon, lat = map(float, point_str.split(','))
            boundary_points.append([lon, lat])
        return boundary_points
    else:
        return None

# User inputs for location, Excel file, background image, and AMap API key
location_name = '苏州'
excel_file = 'poi信息.xlsx'
background_image_path = '底图.png'
amap_api_key = 'xxxxxxxxx'  # 替换 AMap API key

# Create the district map with points
create_district_map_with_points(location_name, excel_file, background_image_path, amap_api_key)
结果


文章评论